- Our Products
- Store Locator
- About Us
Why Use Pittmoss
- Contact Us
The Influence of PittMoss in Spring Growth Trials on the Performance of Berger BM6
Introduction
This summary is presented to provide an overview of trial results from spring of 2019, focusing on the incorporation of PittMoss Grower Grade substrate amendment into the Berger BM6 blend. These trials were performed at the research facility of Dr. Charles L. Bethke in Williamston Michigan.
Replications
Rooted plugs were planted into the trial blends in replications of 6 for the tomatoes and kale, 10 for the marigolds and basil, and 4 in the hanging baskets with 5 plants in each basket of petunias.
Substrates Used
1. BM6 = Berger BM6 (100% from 3.8 compressed bale)
2. BM6GG = 70% BM6 manufactured blended with 30% PittMoss Grower Grade
3. PM1 = PittMoss blend containing 30% PittMoss Grower Grade, 65% Sphagnum and 5% Perlite
4. House = A greenhouse blend of 60% PittMoss Grower Grade, 25% Sphagnum and 15% Perlite
Crops Grown
1 .Tomatoes (cv: Roma) grown in 6” pots
2 .Marigolds (cv: Hero Mix) grown in 4 ½” round pots
3. Kale (cv: Vates) grown in 3 quart nursery pots
4. Basil (cv: Genovese) grown in 4” round pots
5. Petunias (Easy Wave Pastel Mix) in 14” hanging baskets
Production
One-hundred and twenty-eight plugs were planted on April 6th and placed on benches in a double layer poly covered greenhouse. They were initially watered with clear tap water containing a pH of 7.2 with an alkalinity of about 285. The water also contained moderately high levels of sodium and boron. All watering was uniformly applied by overhead irrigation to each crop when any of the plants in the treatments showed water stress. After two weeks of watering with clear tap water, soluble 20-10-20 fertilizer was injected, applying an average rate of near 100 ppm N at every watering until late in May when clear water was alternated with the injected fertilizer pending the completion of the project.
Data
Observations were made as the plants were measured during the two weeks following the 10th of June. Observations for each species included various combinations of: visual plant vigor, leaf color, height, number of leaves, number of blooms, branching, and fresh weight. The data from the replications was statistically analyzed to provide treatment means and their variations. The treatment means were then compared as percentages of the over-all mean. Summaries of the compiled mean comparisons are presented as variations above and below the treatment means for each crop. The crop treatment means for all substrates tested are set at 100%, and the responses vary proportionately above and below the mean. The averages for all crops combined are summarized in the figures below.
Note that these averages are presented as deviations from the treatment means and show the variations above and below the experimental averages. The error bars (to be used for comparisons between treatment means) are for a 5% range of the average treatment means and can be used to estimate significant differences, not to represent variations within specific treatments.
Photos
Photos of individual representative plants from each species, in each blend, were taken at 5 intervals during production: when planted, 10 days, 25 days, 48 days, and 70 days. Representative pictures are presented to help visualize the growth differences of the crops in the various substrates and do not represent exact statistically quantitative growth responses. Adjustments to size and cropping of the subjects presented are to aid in comparisons. The graphic figures are presented for statistical comparisons.
Summary
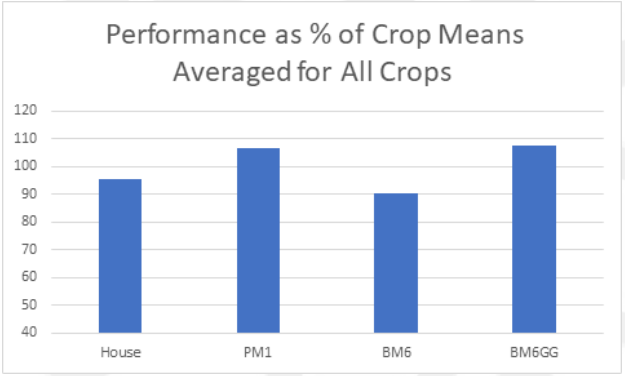
Treatment results for specific crops are presented in the following pages. A final summary is presented graphically on page 11. In it, we see that most crops followed the same pattern. The PM1 and BM6GG were the best performers. The House blend and BM6 did approximately the same. The PittMoss combined with the BM6 added a significant boost in performance, providing an over-all boost in scores of 17%.
Note that early in the crop, few differences could be observed. Being as the differences in responses seemed to develop later in the crop, it is suggested that the benefits were associated with the increased microbial activity, improved water delivery, and better nutrient utilization provided by the PittMoss. This comparison clearly displays that the addition of PittMoss increased the crop performance.
Tomatoes
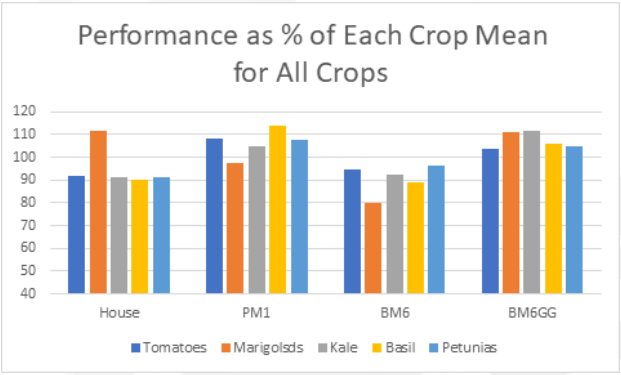
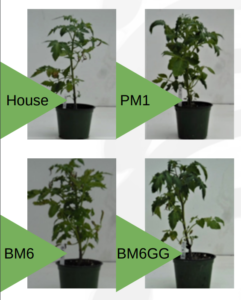
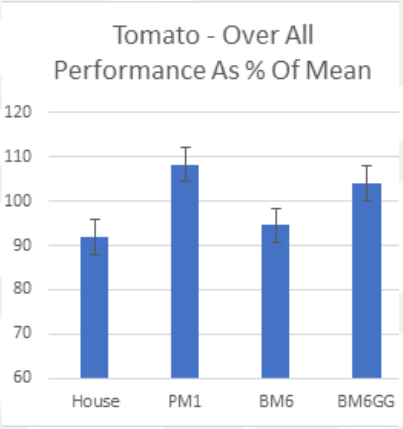
The highest performance in the “Roma” tomatoes was in the PM1 blend. It exceeded all others in height and branching, achieving a score of 108.2% of the mean comparison. Both the House blend and the BM6 had the lowest performance at 91.9% and 94.6% respectively. The addition of 30% Grower Grade PittMoss® to BM6, making BM6GG, produced a significant increase in the performance, to score 104.0% of the mean, compared to 94.6% without the PittMoss. That increase was reflected in the higher fresh weight and taller plants. The number of axillary shoots was about the same for the BM6, PM1, and BM6GG. The representative photos show the differences that can be seen at 48 days of growth. Branching was greater in the BM6GG, with the added PittMoss®. The growth was about the same for the first three weeks in all blends, after which the blends with the PittMoss® advanced. This suggests that the primary benefits of the PittMoss® relate to increased available water and nutrient reserves.
Marigolds
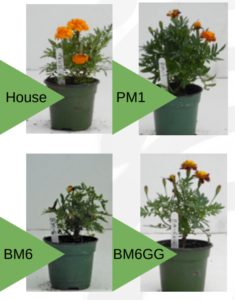
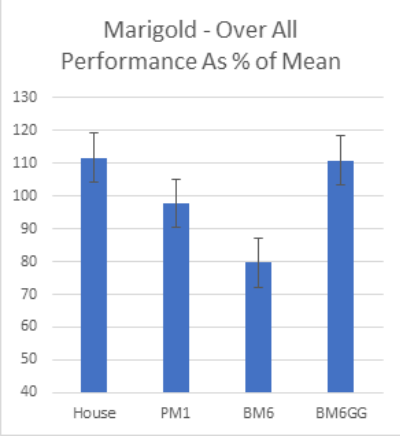
Marigolds (“Hero Mixed Colors”) showed more variability within the ten replications, attributed to the variation in the mixed colors used. However, the performance responses and averages were significantly different between substrates. Evaluations of vigor, plant height, and number of blooms showed that the House blend and BM6GG had the greatest scores at 111.6% and 110.9% of the mean respectively. The added PittMoss® in the BM6GG scored 31.2% higher than BM6 alone. The increased vigor was expressed in taller plants and higher flower counts. The photos below were taken at 48 days and do not properly demonstrate the variance in vigor due to the mixed colors. However, note that the BM6 is significantly less robust than the others. As a general observation, the BM6 was not a good blend for the marigolds.
The added PittMoss® appears to have done three things:
1. Raised the pH
2. Increased microbial activity
3. Increased the available water
Basil
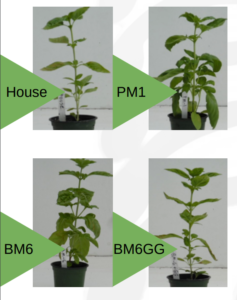
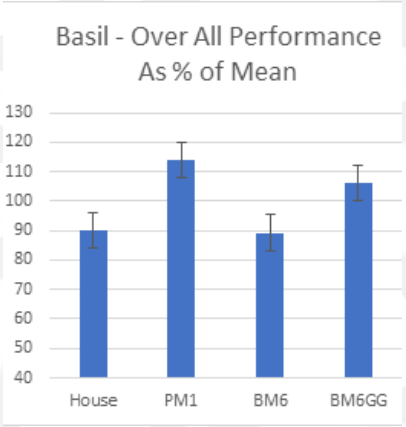
The differences in basil (cv. Genovese) attributed to the blends was small in the beginning. The House blend performed better after some development in the 4” pots. It appears that the starter nutrient charge was a little low. Later in the crop growth, when some moisture stress developed, greater variations began to show. Crops growing in blends containing the PittMoss advanced. In comparing performance, height and fresh weight were measured at 70 days growth. That data is incorporated in the adjacent figure. The BM6 blend performed at 11% below the mean and 25% below the PM1 blend. Adding 30% PittMoss (BM6GG) increased the performance by 17.3% over BM6 alone. Again, the increased performance is attributed to the improved water availability, increased nutrient availability, and increased microbial activity. This was especially significant in the 4” pots and was made apparent in the House blend which has a lower initial nutrient supply. The photos show a representative difference at 48 days growth. Note the increased branching in the PM1. Also, the BM6 photo appears larger but most of the plants were shorter than either the PM1 or BM6GG.
Kale
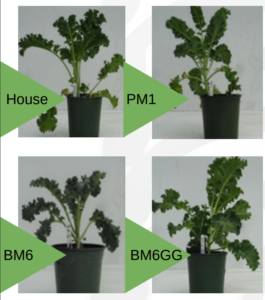
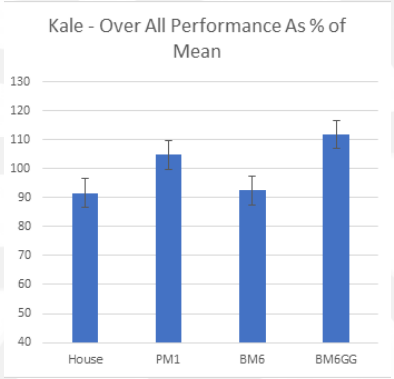
In the “gallon” (3 liters) pots, the kale (cv. Vates) grew larger and provided a good evaluation of the blend’s ability to supply water and nutrients. The crops started out about the same in all blends. A slight lag was observed in the blends with the added PittMoss® Grower Grade that lasted about 10 days before the PittMoss® containing blends began to surpass the others. In the evaluations of vigor, height, and number of leaves, the BM6GG with 30% added PittMoss® scored 19.4% above the BM6 and 19.8% above the House blend. It was about 7% higher than the consistently high performing PM1. While the increase was statistically significant in this comparison, the trend shows the benefits from the added PittMoss. It appeared that the house blend did not supply enough nutrients for the aggressive growth in the kale. The representative photos at 70 days growth, presented below, show some of the differences. However, the plants were too dense on the bench and tended to elongate.
Petunias
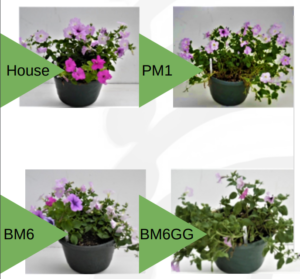
The responses of petunias, growing in 12” hanging baskets, was less dramatic than was observed in the other crops. The petunia baskets were grown on a bench to uniformly control the watering and fertilizer applications. The PM1 again showed the best performance with an overall score at 7.6% above than the mean, apparent in stronger vigor and brighter leaf color. Plant size was average. The PM1 rating was just a little better than BM6GG, which was 4.8% above the mean. The House was 8.9% below the mean. BM6GG with the 30% PittMoss® blended in scored 8.3% higher than BM6 without the PittMoss. Again, the nutrient supply using the House blend and only about 100 ppm N was not adequate. That was demonstrated in lighter leaf color and smaller plants. The photos below, taken at 48 days, show the differences that were measured later in the crop.
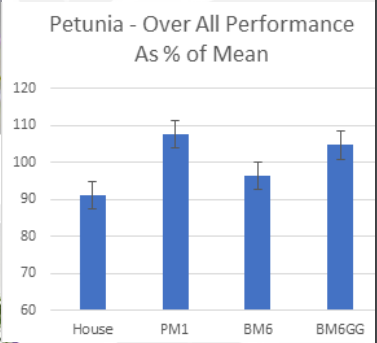
Summary
The relative performance of each crop in each blend is presented as a variation from the crop mean. The average over all crops for each substrate is presented in the lower figure.
